When I wrote this script in 2002 I was not aware of better ways to measure TCP round trip times.
Right now I use hping2 with the syntax: hping2 -S -p 80 -c 3 www.cisco.com
I'll keep this page up for historical reference.
This script requires the excellent tcptraceroute written by Michael C. Toren.
The script is called tcpping, the current version is 2.0 and is now being maintained on github by Orsiris de Jong. Some example output:
$ tcpping www.cisco.com
seq 0: tcp response from www.cisco.com (198.133.219.25) [open]  155.513 ms
seq 1: tcp response from www.cisco.com (198.133.219.25) [open]  148.907 ms
seq 2: tcp response from www.cisco.com (198.133.219.25) [open]  153.686 ms
seq 3: tcp response from www.cisco.com (198.133.219.25) [open]  150.864 ms
seq 4: tcp response from www.cisco.com (198.133.219.25) [open]  147.917 ms
$ tcpping -d www.cisco.com
Fri Dec 20 15:59:27 MET 2002
seq 0: tcp response from www.cisco.com (198.133.219.25) [open]  159.006 ms
Fri Dec 20 15:59:29 MET 2002
seq 1: tcp response from www.cisco.com (198.133.219.25) [open]  148.594 ms
Fri Dec 20 15:59:30 MET 2002
seq 2: tcp response from www.cisco.com (198.133.219.25) [open]  148.394 ms
Fri Dec 20 15:59:31 MET 2002
seq 3: tcp response from www.cisco.com (198.133.219.25) [open]  150.787 ms
Fri Dec 20 15:59:32 MET 2002
$ tcpping -c www.cisco.com
0 1043546228 201.304 www.cisco.com (198.133.219.25)
1 1043546229 195.810 www.cisco.com (198.133.219.25)
2 1043546230 186.759 www.cisco.com (198.133.219.25)
3 1043546231 201.614 www.cisco.com (198.133.219.25)
4 1043546232 245.070 www.cisco.com (198.133.219.25)
5 1043546233 246.764 www.cisco.com (198.133.219.25)
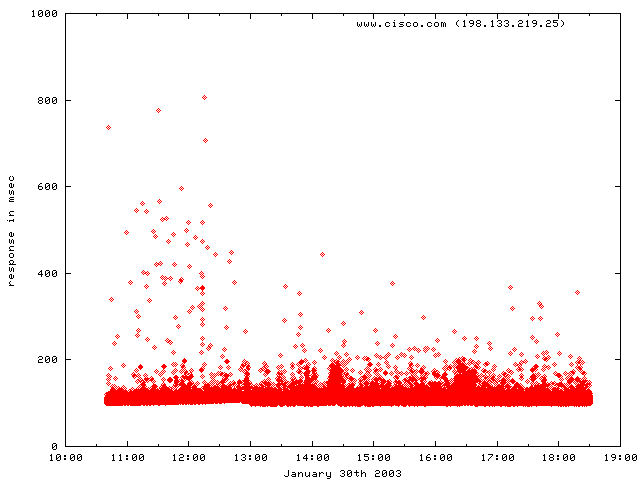
Using the -c switch and this gnuplot script you can produce nice graphs like this: